6 min to read
My Powershell Dashboard Projects
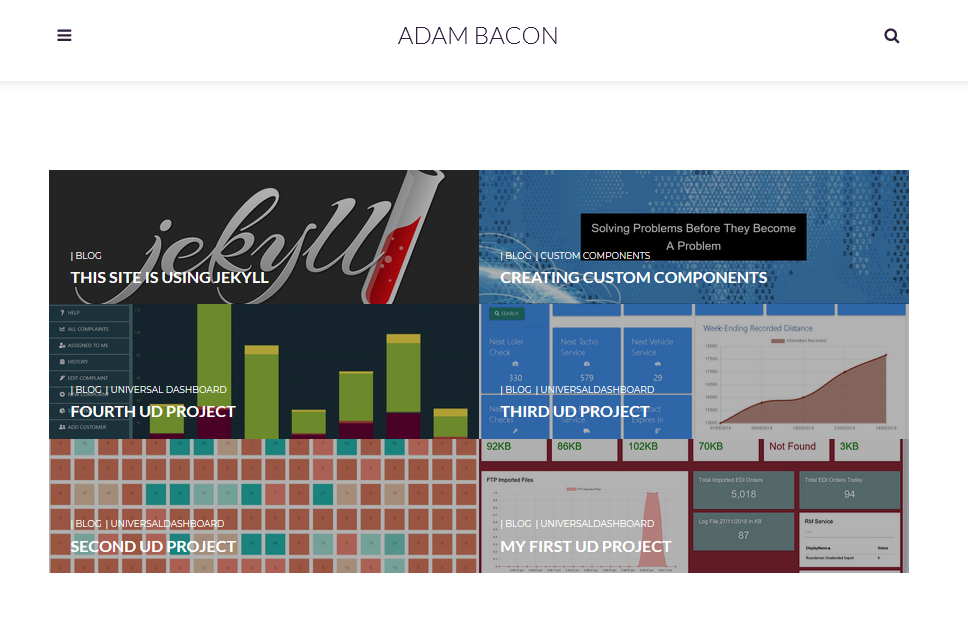
I have another dedicated site to showing some Powershell Universal Dashboard projects I have worked on.
So this page is about my personal journey with powershell universal dashboard. I explain problems I was given to solve at work, and how I used my knowledge of powershell and combined it with this module to be able to provide an end working solution
These projects show how I used Powershell Universal Dashboard to solve the problem, providing a simple yet beautiful interface for the end-users.
Most of these projects are not really I.T related in my opinion. Like they are not doing what I guess most I.T people would consider I.T ‘stuff’ I think this just goes to show you can really use powershell universal dashboard to solve a wide variety of problems. My project blog page is here.
My First UD Project
So I got tasked at work to automate the process of pulling files from an FTP site, removing the files once downloaded, then moving them to a specific folder on the network, so that they can be automatically imported into the database. I accomplished this using scheduled tasks for powershell to run at set time intervals. But how do you know everything is working? Simples design a beautiful dashboard.

So this shows me the previous week of log files along the top and their file sizes (yes we had an issue on the 25/11/2018) shows how many orders have been imported into the network folder and shows how many orders have been done today, and the current size of the log file. It also shows me in real time when files come in to be processed. I also monitor the status of the service which is running on a separate server. This allows me to glance at this dashboard and see if there has been any issues downloading and importing.
This was a great first project to show my colleagues as well as myself that this new bit of software I purchased was proving it’s worth by monitoring something that is a business critical process. I was really happy that I managed to provide a solution to the problem I was given, allowing any staff member to also monitor this daily process and report any issues, that are clearly shown on the dashboard.
Second UD Project
I was tasked with showing previous and future orders so warehouse staff can make sure stocks are at appropriate levels. Thought the nivo heatmap chart was a perfect way to display this data, I have a dynamic sql pivot query, which outputs to csv from that I make the hash table to feed as the data for the nivo chart This is an example of the dashboard in action:-

As the database which holds this information is extremely slow to return the results, I am using a scheduled task to query the database which runs 3 times a day. This schedule task queries the SQL server, then outputs the information to CSV, then I am iterating through the CSV to build an array of hashtables. I need to do this in order to have the data formatted correctly for the nivo heatmap chart.
Third UD Project
I do get tasked with what I might consider on first request very bizarre requests. Like at work a senior manager decided I was the man to build a fleet management system from scratch.
Not knowing about vehicles and what was involved I first off needed to gather information from the people who were currently inputting the information into a spreadsheet.
Armed with the new information on vehicles and the type of information that needed to be recorded, I was able to build a database to store all the required information I needed to gather.
As mentioned this was being managed on a spreadsheet, but was thinking a dashboard is a much better way, so did just that. Put a dashboard in place to allow multiple uses access at the same time, something a spreadsheet can’t, created a back-end database to store all the information, then built some forms on the dashboard with validation rules, and used the data provided from the end user to display statistical information on that particular vehicle. Here is a GIF of the dashboard in action:-

There was a lot of learning and reading of the universal dashboard document. Thankfully the developer of universal dashboard has done a great job documenting all the controls and how to use the module. There is even a site here:- poshud.com which shows off a site running universal dashboard on the internet. This also shows you the user interface controls, and how to use them with some code examples.
There was a lot more work involved in getting this project completed, having got such positive feedback from this dashboard, I decided to share it on my github.
Fourth UD Project
This project actually started about another year before the listed date. I was asked to help put together a proper complaint system for the company. So at the time I was using Powershell Studio 2017 and literally this took me ages to design and code, and this was the best looking thing I could produce:-

As always I was asked to modify ‘things’ within the complaint system, which then meant a whole world of pain for me, as the code is so bloated when using powershell studio as the components you drag an drop onto the page adds so much more code. So it became really difficult for me to maintain, and no matter how hard I tried the forms always looked like they were designed for windows 95. I mean I had been using powershell studio for a good couple of years and that is the best my design ability was within this program.
I wanted to apply a new lok and feel to the complaint system, so I did just that by rebuilding the system in UD:-

I think this is a no-brainer to say that the UD version looks so, so much better. Not only is it better for producing beautiful applications, it is hundreds of times better at producing fancy charts and graphs. Like there is no way on earth I would have been able to produce this in Powershell Studio:-

There is a legend at the top of this explaining what all the different colours on the chart relate to, and the chart has hover-over ability which then shows you the information for what you are hovering over.
I was even able to include a custom component for this dashboard, to receive some feedback from the end-users using my application:-

Thought this would be a good thing to implement to also help me develop the application to be even better by taking suggestions from the feedback being received.
It’s just great to be able to provide applications to help make the company you work for more efficient in dealing with certain things.
I hope these blogs show how versatile Universal Dashboard is, as most of my projects are not really I.T related.