Second UD Project
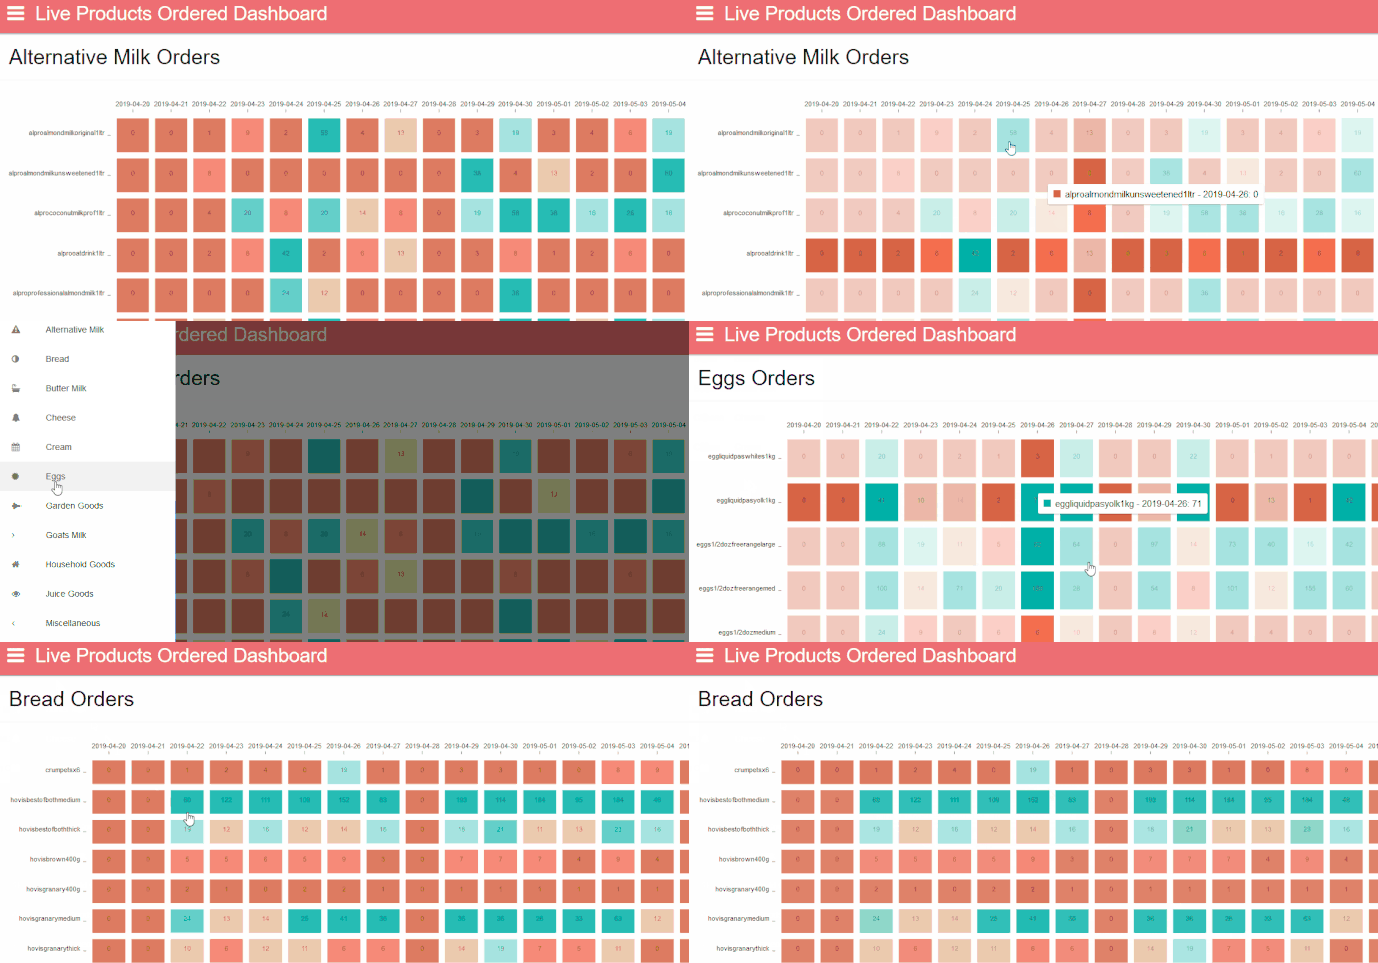
I was tasked with showing previous and future orders so warehouse staff can make sure stocks are at appropriate levels. Thought the nivo heatmap chart was a perfect way to display this data, I have a dynamic sql pivot query, which outputs to csv from that I make the hash table to feed as the data for the nivo chart This is an example of the dashboard in action:-

As the database which holds this information is extremely slow to return the results, I am using a scheduled task to query the database which runs 3 times a day. This schedule task queries the SQL server, then outputs the information to CSV, then I am iterating through the CSV to build an array of hashtables. I need to do this in order to have the data formatted correctly for the nivo heatmap chart.
